The AC2DClosses is an interactive tool which was developed in the VerneDCt project as a didactical platform to visualize the potential savings in resources in a DC distribution grid when compared to the AC standard.
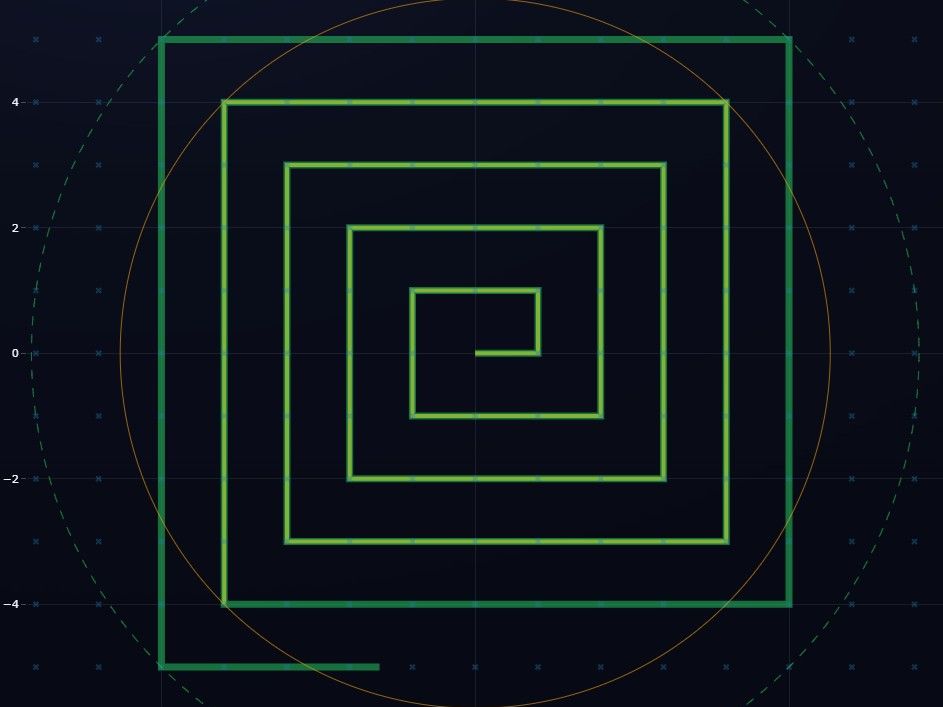
For a given load, voltage level, loss limit, and cable cross-section, the tool (https://frgadotti.github.io/AC2DClosses/) compares how far a line section can “reach” into an area when supplied by AC or DC. By representing possible connection points (nodes) on an grid and drawing the actual paths of AC and DC cables, it allows users to see, in a very intuitive way, how many nodes can be supplied – and how large an area can be covered – under the fixed technical constraints (conductor material, losses, voltage drop, etc.).
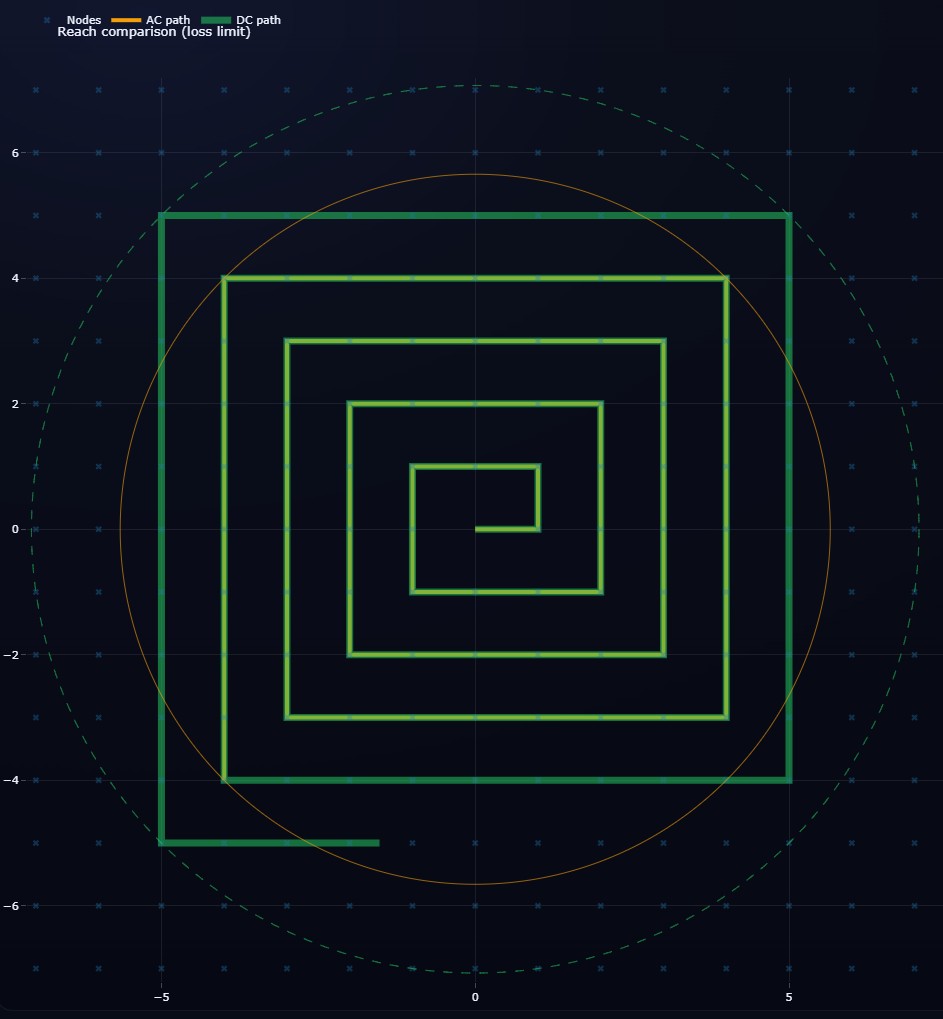
In the context of VerneDCt, this is important because one of the key features of DC technology in distribution grids is better resource efficiency. The tool makes this concept tangible and visually accessible, especially for non-specialists or stakeholders who are not used to reading technical loss calculations or power-flow results. By “playing” with the input parameters and directly seeing the impact on AC and DC reach, users gain an intuitive understanding of why DC is a promising option for future distribution grids, where materials, efficiency, and infrastructure footprint are increasingly critical.

